If you find organizing ideas and stakeholder requirements to see the big picture for a project challenging, using an affinity diagram can help you with that.
An affinity diagram is a powerful tool used for collaboration and organization in project management.
In this post, we’ll cover all you need to know about affinity diagrams, including when to use them, how to create one, and how it can help you improve productivity and decision-making for your next project.
As part of our PMP exam tips, we will review how affinity diagrams are used in the project management processes, and what you need to know about affinity diagrams in the PMP exam to ace any questions you encounter.
What is an Affinity Diagram?
An affinity diagram, also known as an affinity chart, is a tool used to organize ideas and data into groupings based on their natural relationships.
It’s a type of mind map that allows you to structure thoughts and stimulate creative ideas for solving problems.
To create an affinity diagram, you start with a large set of ideas, issues, insights, or other observations related to a project or problem.
These could come from brainstorming sessions, research, surveys, or interviews. The data points are written down, usually on sticky notes, index cards, or pieces of paper.
Next, you physically organize the notes into groups by looking for natural relationships between the items. Items with similarity or a strong connection are clustered together.
These clusters or groups are then labeled with a header or title describing the common theme.
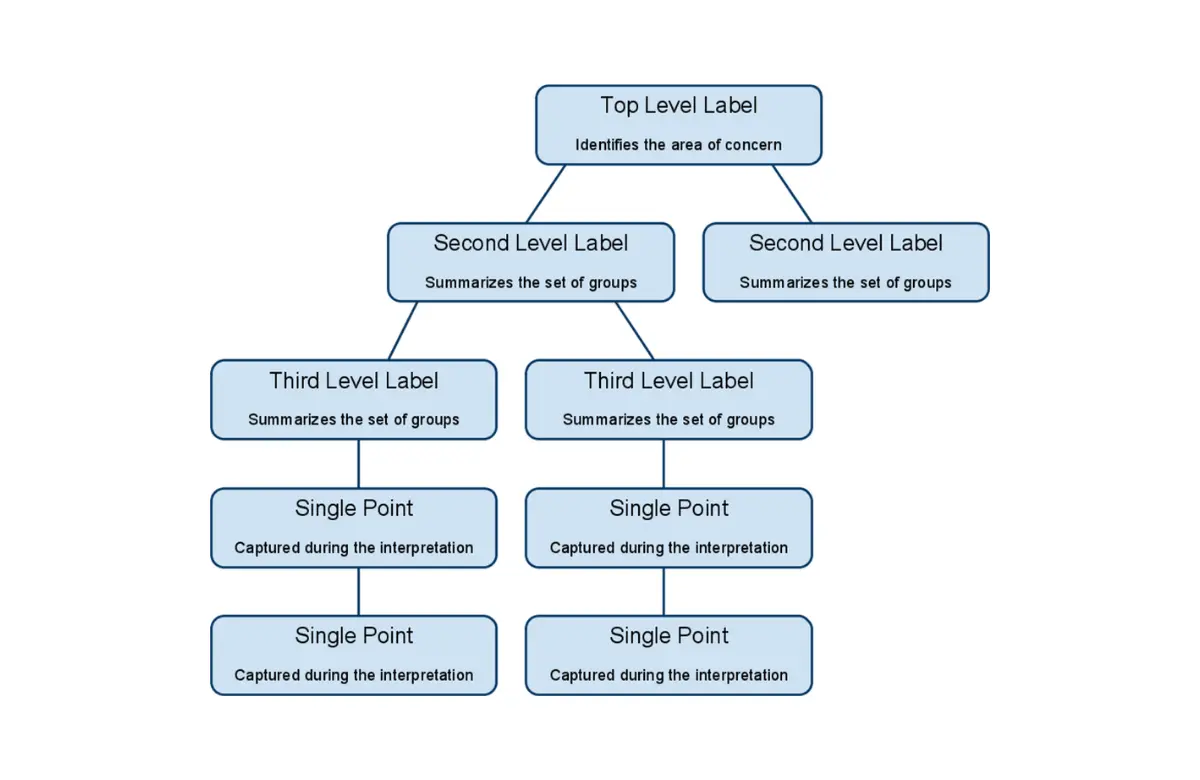
The result is a hierarchical diagram that reflects the insights, key issues, and major concepts.
Affinity diagrams are often created collaboratively in a workshop setting, and the process of creating the diagram itself helps teams organize thoughts, uncover patterns, and derive meaning from complexity.
The structured diagram outcome provides an intuitive visualization of the key ideas and their connections.
When to Use Affinity Diagrams
There are many scenarios where creating an affinity diagram can provide clarity and organization for your project.
Here are some of the most common situations where you might benefit from using an affinity diagram:
1. Unstructured Feedback or Data
If you’re dealing with qualitative data from surveys, user research, or brainstorming that lacks organization, an affinity diagram can help categorize and make sense of it. Clustering unstructured data reveals insights.
2. Subjective Feedback
Open-ended survey responses and feedback can be difficult to analyze. An affinity diagram can group comments by common themes to uncover patterns and relationships.
3. Brainstorming Sessions
Brainstorming sessions generate a lot of raw ideas. Affinity diagrams can bring structure to these ideas helping you to organize the suggestions and evaluate options objectively.
4. Complex Concepts
When an idea or issue is complicated with lots of interdependencies, an affinity map visually expresses relationships so it’s easier to grasp holistically.
5. Multiple Stakeholders
With many diverse teams involved, requirements may seem disconnected. An affinity diagram aligns perspectives so everyone understands from their viewpoint.
6. Identifying Risks or Issues
For complex projects, affinity diagrams can map risks and issues to understand interconnections and impacts across project components.
The key is utilizing affinity diagrams to classify qualitative data, identify linkages, and create order from the subjective to make comprehension easier for teams and stakeholders on complex projects.
You should however try to avoid using affinity diagrams where the data set is small, structured, or simple.
How to Create an Affinity Diagram
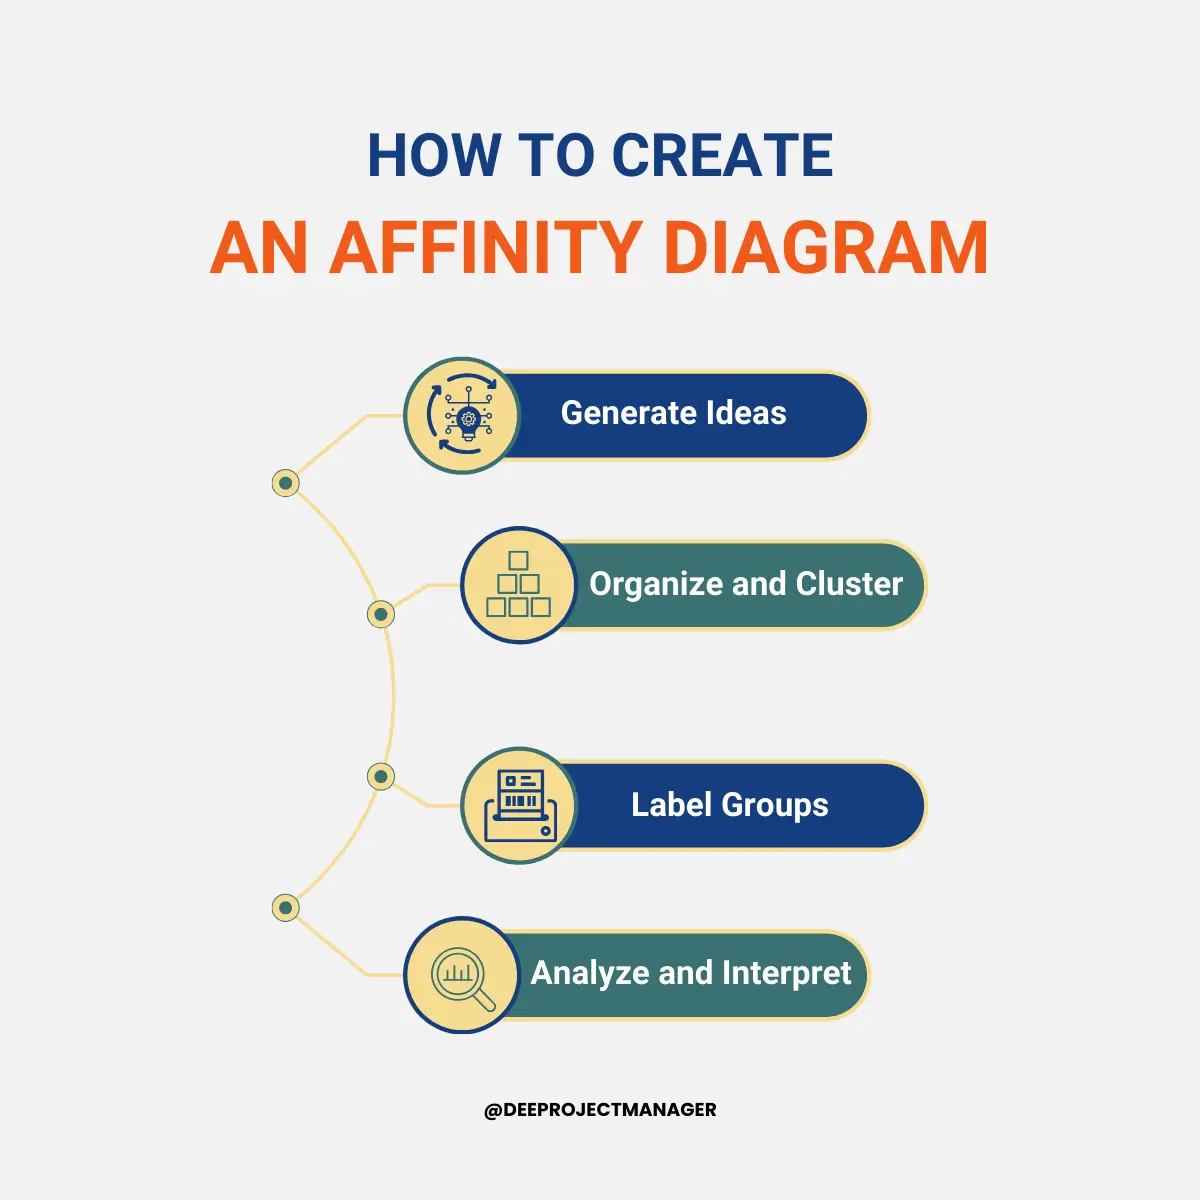
Creating an affinity diagram is a process that can be done manually or using digital tools by following these key steps:
1. Generate Ideas
The first step is to generate as many ideas related to the topic as possible. This can be done through research, surveys, or brainstorming sessions.
Capture each idea, challenge, solution, observation, etc. on individual sticky notes or digital cards.
Make sure to get input from a diverse set of perspectives and document every piece of data whether obviously relevant or not.
2. Organize and Cluster
Having generated ideas related to the topic of interest, have team members look for natural relationships between the data points, physically sort the notes, and place related or similar ideas together in clusters.
Let ideas move between groups as patterns emerge and keep adjusting the groupings until all ideas have a place and groups are conceptually aligned. You can use colored markers to highlight associations.
3. Label Groups
Once satisfied with the clustering, give each group a short descriptive title that summarizes the main concept or theme of that cluster.
The label should encompass all the ideas within that group and help convey meaning at a glance.
4. Analyze and Interpret
Look for relationships between the groups and higher-level associations. You may identify larger categories that several groups fit within. Link related groups with lines/arrows.
Walk through the diagram as a team to uncover insights, priorities, and actionable patterns in the raw data and document findings in a report to share back with stakeholders.
The result should be an intuitive visual diagram that structures subjective ideas and observations into logical groups that reveal underlying meaning and insights.
Benefits of Affinity Diagrams in Project Management
Affinity diagrams offer significant benefits for project managers and teams:
- Organizes Ideas: Affinity mapping brings structure to unfiltered qualitative data like brainstorming notes. This enables you to make sense of disparate ideas and identify logical groupings.
- Facilitates Collaboration: The participatory nature of jointly sorting ideas encourages teamwork. Different perspectives are merged constructively.
- Promotes Consensus: Grouping concepts visually makes it easier to gain alignment on priorities rather than get bogged down in details.
- Generates Insights: Looking at ideas in clusters reveals underlying patterns, themes, and meaningful connections that inspire solutions.
- Improves Focus: Affinity diagrams filter out noise and clarify which ideas matter most to the project so you can focus resources appropriately.
- Enhances Visualization: The affinity diagram format allows people to literally see complex ideas in a structured format which improves understanding.
- Boosts Creativity: The flexible thinking involved in organizing concepts sparks new neural connections that stimulate innovation.
- Documents Decisions: The affinity map serves as an artifact of the group decision-making process that can be shared and referenced later in the project.
- Saves Time: Rather than futile open-ended discussions, affinity diagrams quickly converge ideas towards actionable conclusions.
- User-Friendly: The simple manual process is intuitive. Digital versions also make it easy for remote teams to collaborate visually on affinities.
Integrating affinity diagramming sessions at key points in your project lifecycle will boost team productivity, creativity, and consensus to drive better outcomes. The participatory process also helps engage and motivate team members.
Limitations of Affinity Diagrams
While affinity diagrams offer many benefits, there are a few limitations to consider:
- Time Investment: It takes time to properly brainstorm, organize, analyze, and document a comprehensive affinity diagram. You need to dedicate a few hours of focused team effort.
- Analog Process: Manual sorting of physical sticky notes can be messy and difficult to modify. Capturing the final structure is challenging beyond taking photos.
- Groupthink: There is the risk of closed-mindedness if the team lacks diversity. Group decision-making often trends toward consensus.
- Difficulty Prioritizing: Moving and merging clusters provides perspective, but determining the most critical groups and ideas is still a judgement call.
- Oversimplification: Condensing complex issues into simple affinity groups can overgeneralize or obscure nuances. Some ideas defy grouping.
- Temporary Relevance: The relevance of an affinity diagram is greatest immediately after its creation. New inputs and ideas render it outdated over time.
- Can’t Replace Data: Affinities reveal qualitative insights but are not a substitute for quantitative data analysis and research.
While useful in many scenarios, affinity diagrams should complement other problem-solving and data analysis techniques in your project management toolbox.
Apply them at the appropriate times when collaboration on structuring ideas would unblock progress.
Affinity Diagram Examples
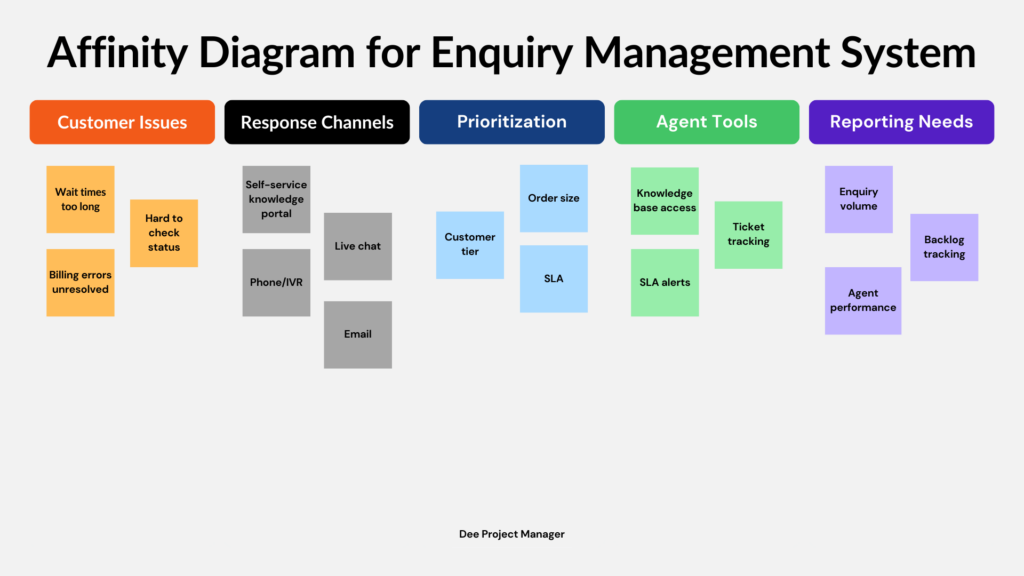
Affinity diagrams can be used to organize ideas across many different project contexts.
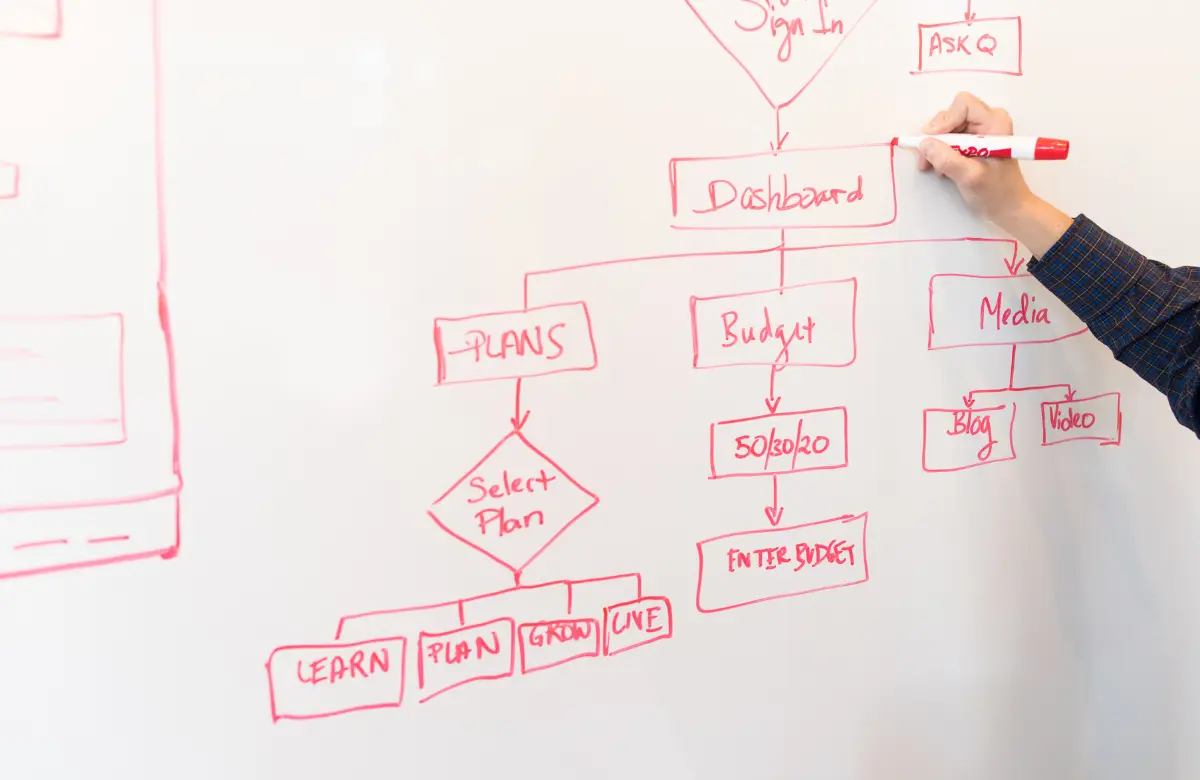
Here is an example related to planning an Enquiry Management System:
Affinity Diagram PMP Exam Tips
The PMP exam tests your knowledge and understanding of PMBOK guide processes, tools, and techniques. Also, it tests your ability to apply them in different situations.
The affinity diagram is a useful tool for the “Collect Requirements” process in the Project Scope Management knowledge area and the “Manage Quality” process in Project Quality Management.
Here are some tips for understanding and applying the concept of the Affinity Diagram on the PMP exam:
- Understand its Purpose: An Affinity Diagram is used to organize and prioritize a large amount of ideas, information, or data into groups based on their natural relationships. It’s often used in brainstorming sessions to generate ideas.
- Know When to Use It: This tool is most commonly used in the Collect Requirements, and Manage Quality processes. It’s especially helpful when dealing with a large amount of data or ideas that need to be categorized and understood.
- Recognize its Structure: An Affinity Diagram typically starts with individual ideas or issues, which are then grouped into related themes or categories. These categories may then be grouped into larger themes or categories, forming a hierarchical structure.
- Appreciate its Value: In the PMP exam, you might be asked about the value of using an Affinity Diagram in a given scenario. This tool can help enhance brainstorming sessions, facilitate team consensus, and assist in the creation of a project’s Work Breakdown Structure (WBS).
- Practice Applying It: Try using this tool in real or hypothetical project scenarios to get a feel for how it works and to better understand its practical applications.
Conclusion
An affinity diagram brings structure and focus to complex projects by visually organizing ideas into logical groups.
This simple yet powerful collaboration technique harnesses team perspectives to uncover insights and align priorities.
Whether you’re planning a new initiative or solving problems, affinity mapping sessions extract clarity from chaos.
By clustering unfiltered thoughts and identifying natural relationships, teams build consensus to push forward decisively.