When planning for a project, you must estimate constraints such as the time, cost, effort, and resources required for various activities and the overall project. The more accurate the estimates are, the better the likelihood of project success.
However, getting these estimates becomes harder as the project size and complexity increase. A solution for this is the three-point PERT estimation technique.
This technique brings order to uncertain estimates by using three data points: Optimistic, Pessimistic, and Most Likely estimates. These get calculated into a weighted average, providing a realistic estimate range.
As a project manager, with PERT estimation you can account for unknowns and variability resulting in better forecasts for completing project work.
This article lays into the PERT estimation method providing insights on leveraging its weighted averaging for smarter project planning.
What is PERT Estimation?
PERT estimation is a project management technique used to estimate the amount of time required to complete project activities. It stands for Program Evaluation and Review Technique.
PERT was developed in the 1950s for the Navy’s Polaris submarine missile program to help manage uncertainty and complexity.
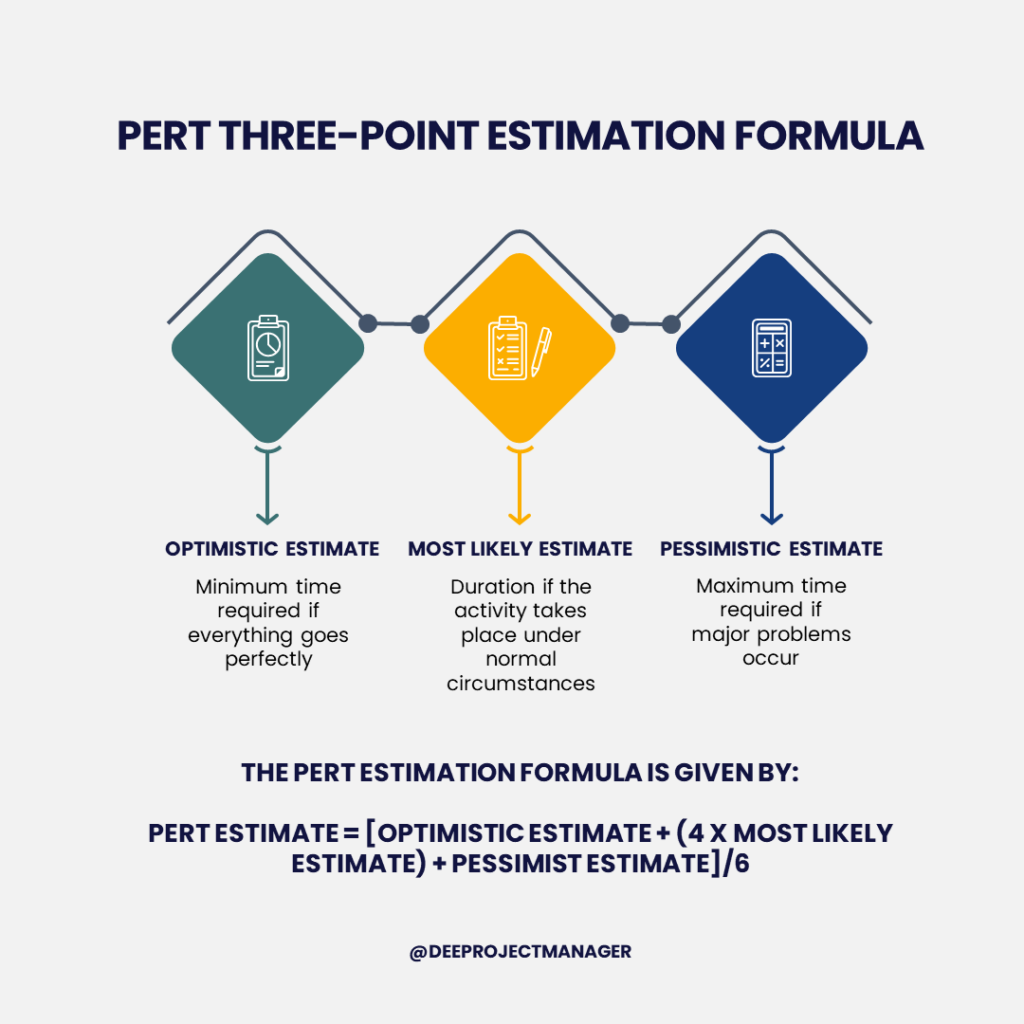
With PERT, you develop three different duration estimates for each project activity:
- Optimistic Estimate: This is the minimum time required if everything goes perfectly
- Pessimistic Estimate: This is the maximum time required if major problems occur
- Most Likely Estimate: This is the duration if the activity takes place under normal circumstances
These three estimates provide a range. To calculate the overall PERT estimate, you take a weighted average of the three estimates giving more weight to the most likely estimate.
This results in a realistic, data-driven estimate that accounts for inherent project variability and uncertainty, and brings statistical analysis to estimation.
By leveraging the 3 estimates, you can expertly estimate activity and project duration, even for complex efforts with unknowns.

PERT Formula
The PERT formula is the mathematical equation used to calculate the weighted average duration estimate in PERT analysis.
It is as follows:
PERT Estimate = [Optimistic Estimate+ (4 x Most Likely Estimate) + Pessimistic Estimate] / 6
Where:
- Optimistic Estimate= shortest activity duration
- Most Likely Estimate = most probable activity duration
- Pessimistic Estimate= longest activity duration
As earlier iterated, more weight is given to the Most Likely estimate to account for its higher probability.

PERT Estimation Example
Let’s look at a PERT estimation example for a project with some uncertainty.
Suppose you are estimating a new software development project for a client. 5 key modules need to be developed, and you need to estimate the duration of each.
For the first module, you estimate:
• Optimistic time: 2 weeks
• Most likely time: 3 weeks
• Pessimistic time: 5 weeks
While you feel confident about the Optimistic and Pessimistic estimates, the Most Likely estimate is more uncertain as some of the requirements are not yet finalized.
To calculate the PERT estimate:
PERT = (Optimistic + 4 x Most Likely + Pessimistic) / 6
PERT = (2 + 4*3 + 5) / 6
PERT Estimate = 3.5 weeks
Going through this PERT estimation process for all 5 modules, the estimates are:
- Module 1: 3.5 weeks
- Module 2: 4 weeks
- Module 3: 5.5 weeks
- Module 4: 3 weeks
- Module 5: 4.5 weeks
The total project estimate sums the PERT estimates for each activity.
Total Project Estimate = 3.5 + 4 + 5.5 + 3 + 4.5 = 20.5 weeks
This PERT analysis accounts for the uncertainty and allows you to provide a realistic estimate to your client.
The weighted average ensures the most likely durations influence the estimates appropriately.
By using PERT, you can develop data-driven forecasts even when details are uncertain. This example demonstrates how using the 3 estimates improves accuracy over single-point estimates.

PERT Estimation Percent of Accuracy
One major benefit of PERT estimating is increased accuracy over single-point estimates.
Research shows PERT estimates are generally within 10% of the actual duration only 63% of the time. However, they fall within 20% of the actual duration 93% of the time.
This demonstrates PERT’s power to narrow in on a realistic range, even with unknowns. 20% accuracy is excellent for early project estimates.
In contrast, single-point estimates are often wildly inaccurate as they provide no range to account for variability.
By leveraging three estimates and a weighted average, PERT analysis bakes accuracy into forecasts. The formula consumes the estimates into a precise probabilistic estimate.
So while PERT is not perfect, it delivers high levels of accuracy. For complex projects, PERT boosts estimation capability. The technique brings needed statistical rigor to an uncertain process.
For your projects, PERT can raise estimation accuracy to over 90% which enables smart planning despite unknowns.
While a good number of project managers favor using the Monte Carlo analysis, PERT estimation has its uses.
Advantages of PERT Estimation
PERT estimation technique equips project teams with data, statistics, and modeling power which when leveraged drives accuracy in complex project environments.
Some of the top key advantages of this estimation approach to project forecasting include:
Provides Range of Estimates
By leveraging three data points which are Optimistic, Pessimistic, and Most Likely, PERT gives you an estimate range that accounts for variability and unknowns. Having a range prevents planning for only one unrealistic outcome.
Calculates Weighted Average
The PERT formula calculates a weighted average of the three estimates which prevents extreme outliers from skewing the data. The most likely estimate appropriately influences the final figure.
Models Uncertainty
PERT bakes uncertainty directly into estimates through the three-point system. By definition, it handles unknowns and ambiguity better than single-point estimating. You model project uncertainty mathematically.
Enables Risk Planning
The estimate range empowers risk planning. Since you have an optimistic and pessimistic estimate, you can quantify threats and determine mitigation actions which is far superior to point estimates.
Provides Statistical Rigor
PERT analysis brings probability, statistics, and modeling to estimation. This provides mathematical credibility compared to intuition-based guessing. The result is data-driven forecasting.

Disadvantages of PERT Estimation
While PERT estimation has many benefits, it also comes with some downsides to consider:
Time-Consuming
Developing three accurate estimates per activity takes time. The Optimistic, Pessimistic, and Most Likely figures must be grounded in data and this level of analysis requires substantial upfront effort.
Dependent on Estimating Skill
As you know, garbage in, garbage out. Thus, the quality of PERT estimates depends wholly on the estimator’s skills. Subjectivity in the three estimates reduces the accuracy of the final weighted average.
Oversimplifies Duration
Some critics argue that the PERT estimation method oversimplifies activity duration as a normal distribution as in reality durations may be more dynamic or follow different distributions.
Scope for Error
Despite using statistics, PERT still contains errors as estimates are predictions. The 10-20% margin demonstrates the inaccuracy that is inherent in forecasting.
Limited Use Cases
PERT is best suited for projects with significant uncertainty. For simple efforts with low variability, it provides limited additional value over single-point estimates.
Final Thoughts
The PERT estimation technique is a proven way to improve project forecasts. By using three estimates and a weighted average, PERT accounts for uncertainty which results in realistic project estimates, even with unknowns.
With practice, project teams can become skilled at PERT analysis and leverage its statistical rigor to boost estimation capability.


