
Risk management is a critical part of any project, and your ability to identify, analyze, and plan responses for project risks as a project manager sets you up for success.
One effective technique for analyzing risks qualitatively is using the probability and impact matrix. This tool allows you to visualize the likelihood and potential impact of project risks, enabling you to prioritize them effectively.
In this post, we’ll explore what a probability and impact matrix is, how to create one, and how to use it for robust qualitative risk analysis. You’ll learn how to assess both risk probability and impact, plot risks on the matrix, and develop data-driven risk mitigation strategies.
With the help of the probability and impact matrix, you can tackle project uncertainties head-on and deliver successful project outcomes.
What is a Probability and Impact Matrix?
A probability and impact matrix, also known as a risk matrix, is a tool used to visually analyze risks in a project. It allows you to assess the likelihood of each identified risk occurring along with the impact it would have on the project if it did occur.
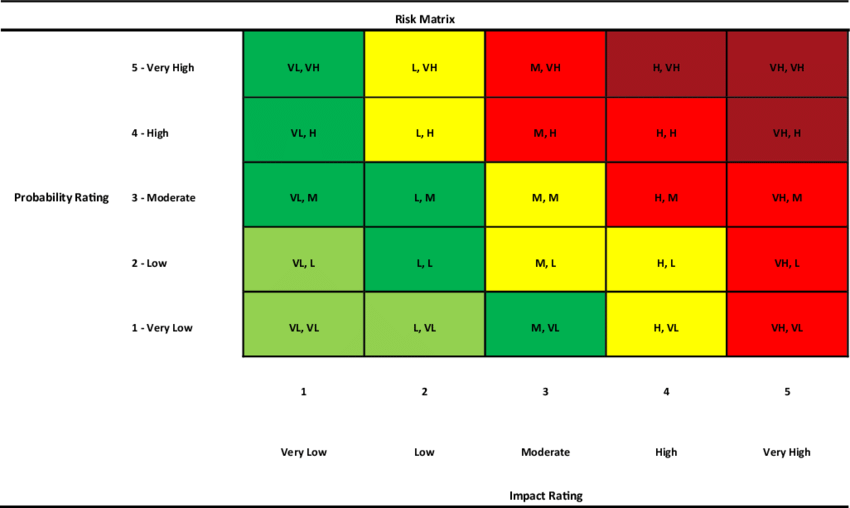
The matrix has two axes – one depicting probability or likelihood, and the other showing impact. The probability and impact scales can use numeric values like 1-5 or qualitative ratings like low-medium-high. Each project risk is then mapped on the matrix based on its probability and impact ratings.
For example, a risk with high likelihood and high impact would be plotted in the top right quadrant, while one with low likelihood and low impact would go in the bottom left. The color coding of the quadrants also allows you to easily prioritize the risks into high, moderate, and low categories.
Overall, the probability and impact matrix gives you a snapshot of all project risks on a single page so you can focus your attention on the high-probability, high-impact risks that need mitigation. It is an invaluable qualitative risk analysis tool for project managers.
Understanding Risk Probability
When creating a probability and impact matrix, the first step is assessing the likelihood or probability of each identified risk occurring in the project.
Risk probability refers to the chance that a specific risk event will occur during the project lifecycle.
To determine probability, you can use quantitative analysis by assigning numerical values like percentages based on past data. For example, if a similar project faced delays 30% of the time, you could assign a 0.3 probability of delays.
However, in most cases, qualitative techniques are used where you estimate probability subjectively based on expert judgment and experience. Common qualitative scales are numerical (1-5) or descriptive like very high, high, medium, low, and very low.
Factors that influence risk probability include:
- The complexity and novelty of the project
- The capability and experience of the project team
- Historical data from similar projects
- Intuition of experts
- External influences like weather, politics, environment
Accurately estimating risk probability requires combining quantitative data where available with the qualitative insights of project stakeholders.
When managing a project, you need to leverage all relevant information to evaluate likelihood realistically which enables you to focus on and plan for high probability risks.
Impact Assessment of Risks
Once you’ve assessed risk probability, the next step is determining the impact each risk would have on your project if it materialized.
Risk impact refers to the negative effects or consequences that the risk event would cause to the project’s objectives. You need to evaluate the potential impact on key success criteria like:
- Schedule – How much delay can occur due to the risk?
- Cost – What is the financial impact or cost increase if the risk occurs?
- Scope – Will the risk cause changes or reduction in project scope?
- Quality – How will the risk affect the quality of deliverables?
- Resources – Does the risk require more resources, or affect resource productivity?
- Reputation – Will the occurrence of the risk damage your or your organization’s reputation?
- Safety – Does the risk impact health, safety, and the environment?
Similar to probability, you can quantify impact in monetary terms or duration. But usually, qualitative ratings like high, medium, and low are used based on expert judgment of potential consequences.
It’s crucial to evaluate impact not just on core project objectives, but also on peripheral success criteria and stakeholders. The higher the negative impact, the higher the priority for risk mitigation.
An accurate and comprehensive impact assessment ensures your risk analysis highlights the most pertinent threats needing attention.
Consider impact over the short and long term, direct and indirect effects, and intangible as well as tangible impacts.
How to Create a Probability and Impact Matrix
After assessing individual risks for probability and impact, the next step is consolidating that analysis into a probability and impact matrix.
To create the matrix, follow these key steps:
1. Define Probability and Impact Scales
Start by defining numeric scales for probability and impact tailored to your project. For example:
Probability
- 5 – Very high
- 4 – High
- 3 – Medium
- 2 – Low
- 1 – Very low
Impact
- 5 – Extreme/catastrophic
- 4 – Major
- 3 – Moderate
- 2 – Minor
- 1 – Negligible
You can also use descriptive scales like high/medium/low. Ensure the stakeholders are aligned on the scale definitions.
2. Plot Risks on the Matrix
Next, map each identified risk on the matrix based on its probability and impact ratings. Risks with higher probability and impact will fall in the top right quadrants.
3. Color Code the Matrix
Use color coding like red, yellow, and green to visually distinguish high, moderate, and low-priority risks.
4. Develop Risk Strategies
Analyze risk distributions and develop mitigation strategies. Focus on tackling the high-probability, and high-impact risks in the red zone first.
With these steps, you can create an insightful probability and impact matrix to support data-driven decision-making for qualitative risk analysis and response planning.
How to Read a Probability and Impact Matrix
The probability and impact matrix provides a powerful visual overview of all identified risks on one page. But how do you interpret it to drive risk management?
Here are some tips:
- Focus on the red-coded risks in the top right high probability, high impact quadrants as these require priority mitigation efforts.
- Don’t ignore yellow moderate risks – be proactive in planning responses.
- Monitor green low-priority risks but allocate fewer resources to managing them.
- Look for risk clustering in certain quadrants to spot trends and common causes.
- Assess the overall distribution – are risks dispersed or concentrated in a particular zone?
- Identify correlations between risks to uncover secondary or cascading risks.
- Re-evaluate risk ratings periodically and shift risks on the matrix as needed.
- Watch for risks with asymmetric impact and probability ratings – a high-impact risk with low probability may still warrant attention.
With experience, you will be able to translate the insights from the matrix into appropriate risk response plans, resource allocation, and prioritization.
The probability and impact matrix acts like a risk heatmap – enabling quick visual pattern recognition to support your qualitative risk analysis. Use it to have productive discussions with your team and stakeholders regarding the risk landscape and agree on mitigation strategies.
Advantages of Probability and Impact Matrix
By consolidating all key project risks into a compact, visual format, the probability and impact matrix offers significant benefits for risk management including:
Visual Representation
The matrix format provides a visual heatmap of the full risk portfolio on a single page which helps to easily compare risk likelihoods and impacts.
Risk Prioritization
The color coding and quadrant positioning allow clear prioritization of risks into high, moderate, and low categories.
Qualitative Analysis
It supports effective qualitative analysis of risks, allowing project managers to identify trends, correlations, and outliers.
Risk Tracking
Dynamic risks can be tracked over time by periodically updating and shifting their position on the matrix.
Consensus Building
The matrix gives a common platform for the team to discuss risks objectively and align on strategies.
Risk Ownership
Individual risks can be assigned to risk owners best suited to manage them based on probability and impact ratings.
Disadvantages of Probability and Impact Matrix
While the probability and impact matrix is an invaluable qualitative risk analysis tool, it has its fair share of limitations:
Subjective Ratings
Probability and impact ratings depend heavily on expert judgment and can thus be subjective. Overconfidence or ambiguity in assessments may skew results.
Lack of Precision
The descriptive scales lack the precision of quantitative analysis so minor differences between risks may not emerge.
Resource Requirements
The process is resource-intensive and significant time and effort are required to source and validate the inputs into the risk matrix.
Limited Context
The high-level overview nature of the matrix provides limited contextual information about individual risks.
Fixed Scales
The defined rating scales impose constraints on accurately mapping risks unless risks are reviewed frequently.
Probability and Impact Matrix Example
Let’s consider an example project to build a new mobile app in 6 months with a budget of $100,000.
The project manager first identifies key risks like:
- New feature creep (R1)
- App testing delays (R2)
- Vendor delivery delays (R3)
- Scope reduction (R4)
- Budget overruns (R5)
The probability and impact of each risk is then estimated as:
- R1: Probability (3), Impact (2)
- R2: Probability (4), Impact (4)
- R3: Probability (2), Impact (3)
- R4: Probability (1), Impact (5)
- R5: Probability (5), Impact (5)
These risks are plotted on a probability and impact matrix with scales of 1-5. R2 falls in the red high priority zone, R5 in the dark red very high priority zone, R1 in yellow moderate priority, R3 in yellow, and R4 in green low priority.
This allows the project manager to focus on mitigating R2 and R5 first which can significantly impact schedule and budget. R1 can be monitored while R3 and R4 are low priority.
This example illustrates how the probability and impact matrix can be leveraged for a specific project scenario to visually map risks based on likelihood and impact for effective qualitative risk analysis.
Probability and Impact Matrix PMP Exam Tips
As outlined in the PMBOK Guide, the Probability and Impact Matrix is a critical tool used in the project risk management process.
It assists in the qualitative risk analysis phase by evaluating and prioritizing risks based on their likelihood of occurrence (probability) and potential effect on project objectives (impact).
When preparing for the PMP exam, understand that this matrix is primarily created during the “Plan Risk Management” process and employed extensively in the “Perform Qualitative Risk Analysis” process.
Focus on:
- Grasping the Concept: Know that risks are plotted on a grid, with probability on one axis and impact on the other. Each risk is then scored and mapped accordingly, which aids in determining the risk magnitude.
- Memorizing the Process: Remember that the matrix is a part of iterative risk analysis and is revisited during the “Monitor and Control Risks” process to reflect new information or changes in project conditions.
- Applying the Knowledge: Be prepared to answer exam questions that may require you to interpret a basic Probability and Impact Matrix, and make decisions based on its analysis.
Understanding the application of this matrix is vital for the exam, as it plays a significant role in risk prioritization, which directly influences risk response strategies and project decisions.
Conclusion
The probability and impact matrix is an invaluable qualitative risk analysis tool that allows you to visualize the complete risk landscape of your project on one page.
By assessing risk likelihood and potential impact, you can easily prioritize risks for mitigation. This matrix enables data-driven decision-making, consensus building, and targeted resource allocation for tackling risks.
With an understanding of project risk probability, impact, and how to leverage the matrix, you can proactively manage uncertainties and maximize the probability of project success.