Ensuring quality throughout the project lifecycle is an integral part of project management and your responsibility as a project manager. But how do you actually measure quality? That’s where quality metrics come in.
Quality metrics allow you to track key aspects like process efficiency, product defects, and customer satisfaction. You can identify potential risks and improvements early by implementing the right quality metrics in your project management strategy.
In this article, we’ll cover what quality metrics in project management entail, why they’re important, how to implement them, and tools to measure them effectively.
You’ll also learn about common challenges to implementing quality metrics and how to address them to help drive continuous improvement in your project management approach.
What are Quality Metrics in Project Management?
Quality metrics are quantifiable measures used to evaluate and monitor various aspects of a project’s performance.
You can leverage quality metrics to gain insights into how efficiently your team is executing the project, whether you’re meeting quality standards, and whether the final deliverables will satisfy customer needs.
These metrics allow you to track key performance indicators (KPIs) like defect rates, rework instances, process cycle times, and your overall team productivity.
By regularly analyzing these metrics, you can identify potential risks, bottlenecks, and areas for improvement enabling data-driven decision-making to optimize processes, ensure alignment with requirements, and proactively mitigate risks.
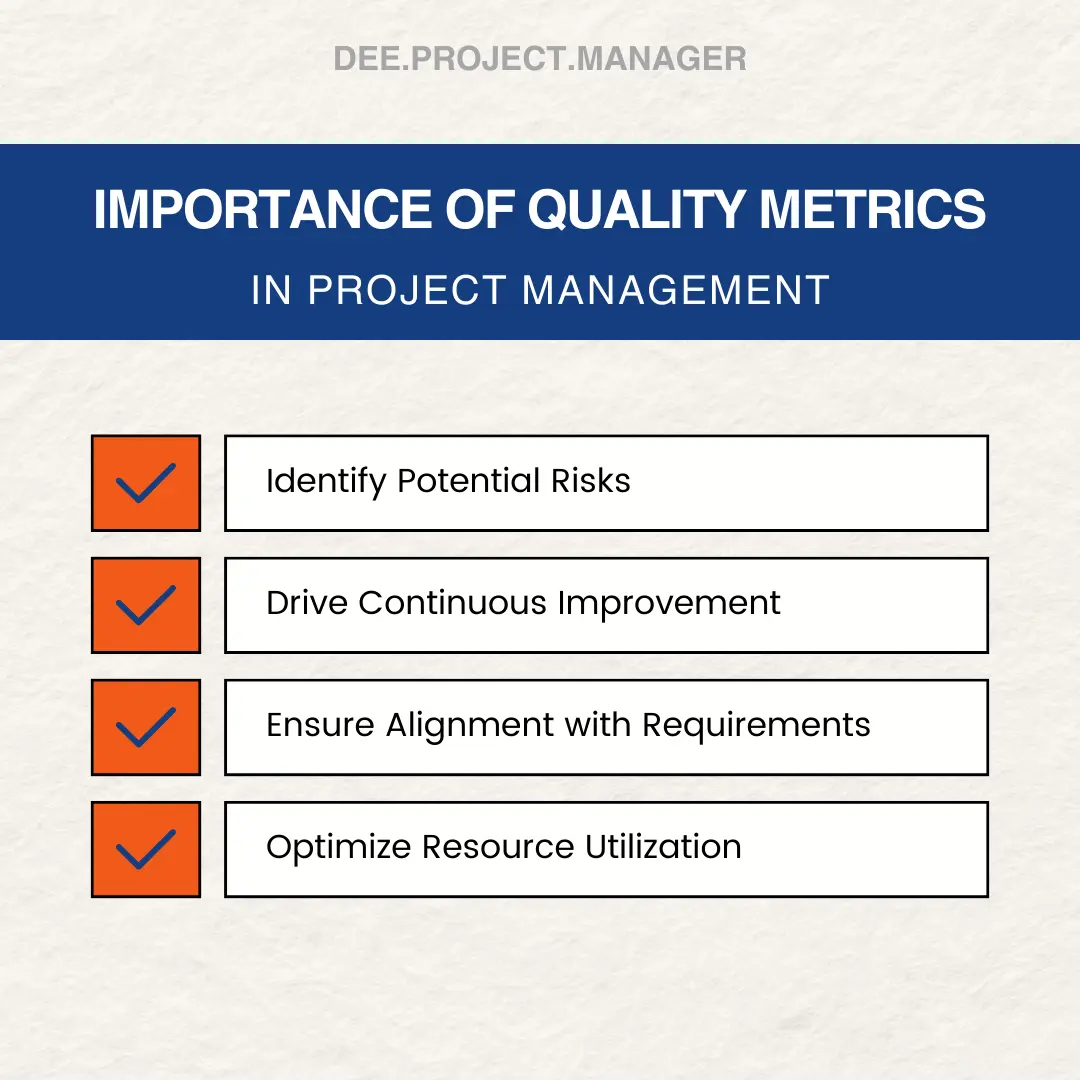
Importance of Quality Metrics in Project Management
Quality metrics play a vital role in project management by providing data-driven insights that enable you to enhance project outcomes.
Here are some reasons why quality metrics are so crucial for project success:
Identify Potential Risks
By regularly tracking quality metrics like defect rates, cycle times, and budget utilization, you can detect inefficiencies, bottlenecks, and other issues.
This allows you to identify risks proactively and take corrective actions before those risks escalate and jeopardize your project.
Drive Continuous Improvement
A mindset of continuous improvement mindset is key to long-term success. Analyzing quality metrics uncovers areas where processes, tools, designs, or competencies are lacking.
You can then implement targeted improvements to boost team productivity, streamline processes, and enhance quality.
Ensure Alignment with Requirements
Quality metrics related to requirements traceability, testing coverage, and customer satisfaction help determine if the deliverables meet stakeholder expectations.
This alignment is crucial for preventing rework and delivering customer value.
Optimize Resource Utilization
Metrics like budget utilization and task completion rates provide visibility into how effectively resources are deployed which enables you to optimize utilization by re-balancing workloads and training teams.

Examples of Quality Metrics in Project Management
Many types of quality metrics provide valuable insights into your project’s performance including:
Defect Rate
The defect rate measures the number of defects discovered per unit of work, and a high defect rate indicates issues in the development processes.
Tracking this metric allows you to pinpoint problem areas and improve quality control.
Rework Instances
This metric counts the number of times a deliverable had to be reworked due to unmet requirements or quality issues.
Minimizing rework improves team productivity and reduces costs.
Customer Satisfaction
Customer satisfaction metrics like Net Promoter Score track how likely customers are to recommend your product.
High customer satisfaction demonstrates you are meeting requirements and aligning deliverables to needs.
Cost Performance Index (CPI)
The Cost Performance Index allows you to optimize spending by measuring the value of work completed compared to the actual cost.
A CPI above 1 indicates the project is under budget, while a CPI below 1 means it is over budget.
Schedule Performance Index (SPI)
Similarly, the Schedule Performance Index helps you identify schedule issues in your project by comparing the completed work to the planned schedule.
An SPI above 1 shows the project is ahead of schedule, while below 1 indicates delays.
Requirements Coverage
This metric examines the percentage of requirements addressed by test cases to ensure all requirements are covered during testing. Having a higher coverage reduces gaps.
Code Quality
Code quality tools allow you to optimize code quality by analyzing the source code against standards like readability, maintainability, and security.

How to Implement Quality Metrics in Your Project Management Strategy
Implementing quality metrics requires careful planning and execution.
Here are some best practices you can use to effectively embed quality metrics within your project management strategy and culture:
Identify Relevant Metrics
First, determine which quality metrics provide the most valuable insights based on your project type, size, industry, and objectives.
You should involve your team when selecting metrics to boost buy-in.
Potential categories include:
- Process efficiency
- Deliverable defects
- Resource utilization
- Customer satisfaction
- Requirements coverage
Focus on metrics tied to your critical success factors and limit your choice to 5-10 key metrics to avoid data overload.
Define Measurement Procedures
Outline consistent procedures for collecting, analyzing, and reporting data for each chosen metric.
Define the measurement frequency, data sources, collection methods, and required tools, and establish thresholds for assessing performance.
Standardizing these procedures optimizes data accuracy and consistency.
Implement Data Collection
Next, implement mechanisms to systematically gather metric data, and integrate data collection into existing processes to minimize disruption.
Leverage tools like Teamhub’s project management software which automate data capture, and define the protocols for data validation.
Analyze and Interpret Data
Analyzing the data is the most crucial step. Turn raw metrics into meaningful insights by identifying trends, outliers, and patterns, then compare the results against targets and previous periods to draw conclusions about the root causes behind the data.
Operationalize Insights
Use the findings to make data-driven decisions on improvements. This may involve process enhancements, training, tool implementation, or resource reallocation.
Update your project plans to reflect these changes and track the effectiveness of the changes through sustained metric monitoring.
Review and Retune
Periodically evaluate your metrics portfolio and measurement procedures, then adjust them based on evolving needs and challenges.

Challenges to Implementing Quality Metrics in Project Management
Implementing an effective quality metrics program in project management poses its unique challenges.
However, with strategic planning and change management, you can successfully address these common quality metric implementation hurdles
Some of these challenges include:
Obtaining Accurate Data
Inaccurate or incomplete data severely impacts analysis and decisions. Some causes of this include unclear measurement procedures, misconfigured tools, or inadequate validation.
You can promote data accuracy through training, documentation, automation, and audits.
Agreeing on Metrics
Another challenge is the tendency for stakeholders to disagree on the most useful metrics due to differing priorities or lack of metric knowledge.
Ways to overcome this challenge include developing metrics collaboratively and communicating their strategic value. Then gradually introduce new metrics after establishing a foundational set.
Metric Target Setting
Setting challenging yet realistic targets requires extensive benchmarking, forecasting, and experimentation.
Without proper context, targets may be perceived as arbitrary or produce distorted results if set too high or low. So take adequate time to define meaningful targets.
Analyzing Complex Metrics
Certain metrics can be difficult to interpret due to complex calculations, external influences, or counterintuitive correlations.
A way of overcoming this analysis challenge is by leveraging statistical analysis skills and benchmarking data. You may consider third-party expertise on advanced metrics.
Achieving Buy-in
Adopting new metrics disrupts the status quo, so expect resistance.
You can win support through change management tactics like early communication, training, and highlighting benefits, as well as incentivizing metrics adoption and showcasing quick wins.
Metric Governance
Metric chaos arises from a lack of ownership, accountability, and policies for metrics management.
It’s important to establish standards on roles, processes, tooling, and reporting cadence, and audit periodically.

Tools for Measuring Quality Metrics in Project Management
Robust tools and automation are key enablers for monitoring quality metrics effectively.
By leveraging the right measurement tools for your needs, you can significantly enhance your quality metrics program with actionable insights, automation, and stakeholder alignment.
Some useful tools include:
Project Management Software
Tools like Teamhub integrate quality metrics tracking into core project functions like task management, reporting, and resource forecasting. This centralized approach boosts visibility and streamlines data collection.
Business Intelligence Platforms
BI platforms such as Tableau provide capabilities for aggregating, analyzing, and visualizing quality metrics from across multiple sources as well as a self-service model that allows you to quickly generate insights.
Requirements Management Tools
Requirements management tools assist with managing and tracing requirements coverage and changes.
This is invaluable for measuring alignment with specifications. An example is Jama which allows tracing requirements to test cases and defects.
Code Quality Analyzers
Static code analysis tools like SonarQube and Lint examine source code against quality standards, security flaws, and technical debt which help to optimize code quality.
Testing Management Tools
Test management tools such as Zephyr track key test coverage and defect metrics giving end-to-end visibility through their integrations with project management systems.
Customer Feedback Systems
Online survey tools and feedback platforms standardize the collection of Voice of Customer metrics like NPS and satisfaction, integrated with CRM and support systems.
Data Visualization Software
Visualization software improves understanding of metric data trends through interactive dashboards. Options to use for this range from basic charts to advanced 3D and geospatial graphics.
Conclusion
Embedding a quality-driven mindset and implementing quality metrics enables data-driven project management centered on meeting objectives, mitigating risks, and maximizing value.
By identifying the right metrics for your needs, measuring them consistently, analyzing the insights, and taking action, you can drive continuous improvement.
While adopting quality metrics poses some challenges, the tools and strategies discussed can set you on the path to higher quality, enhanced efficiency, and improved customer satisfaction.

