When managing a project, you need to monitor your project’s progress and performance regularly to know if you are on track to success.
Two important metrics for this are the Schedule Performance Index (SPI) and Cost Performance Index (CPI). Both of these indexes help you understand your project’s efficiency in terms of schedule and budget.
In this post, we’ll compare SPI vs CPI, explain how they are calculated and interpreted, and highlight the key differences between the two indexes. We will also walk through examples to demonstrate how SPI and CPI can be used to analyze your project.
Understanding these concepts is crucial for project managers whether experienced or aspiring as well as PMP exam candidates.
SPI vs CPI Overview
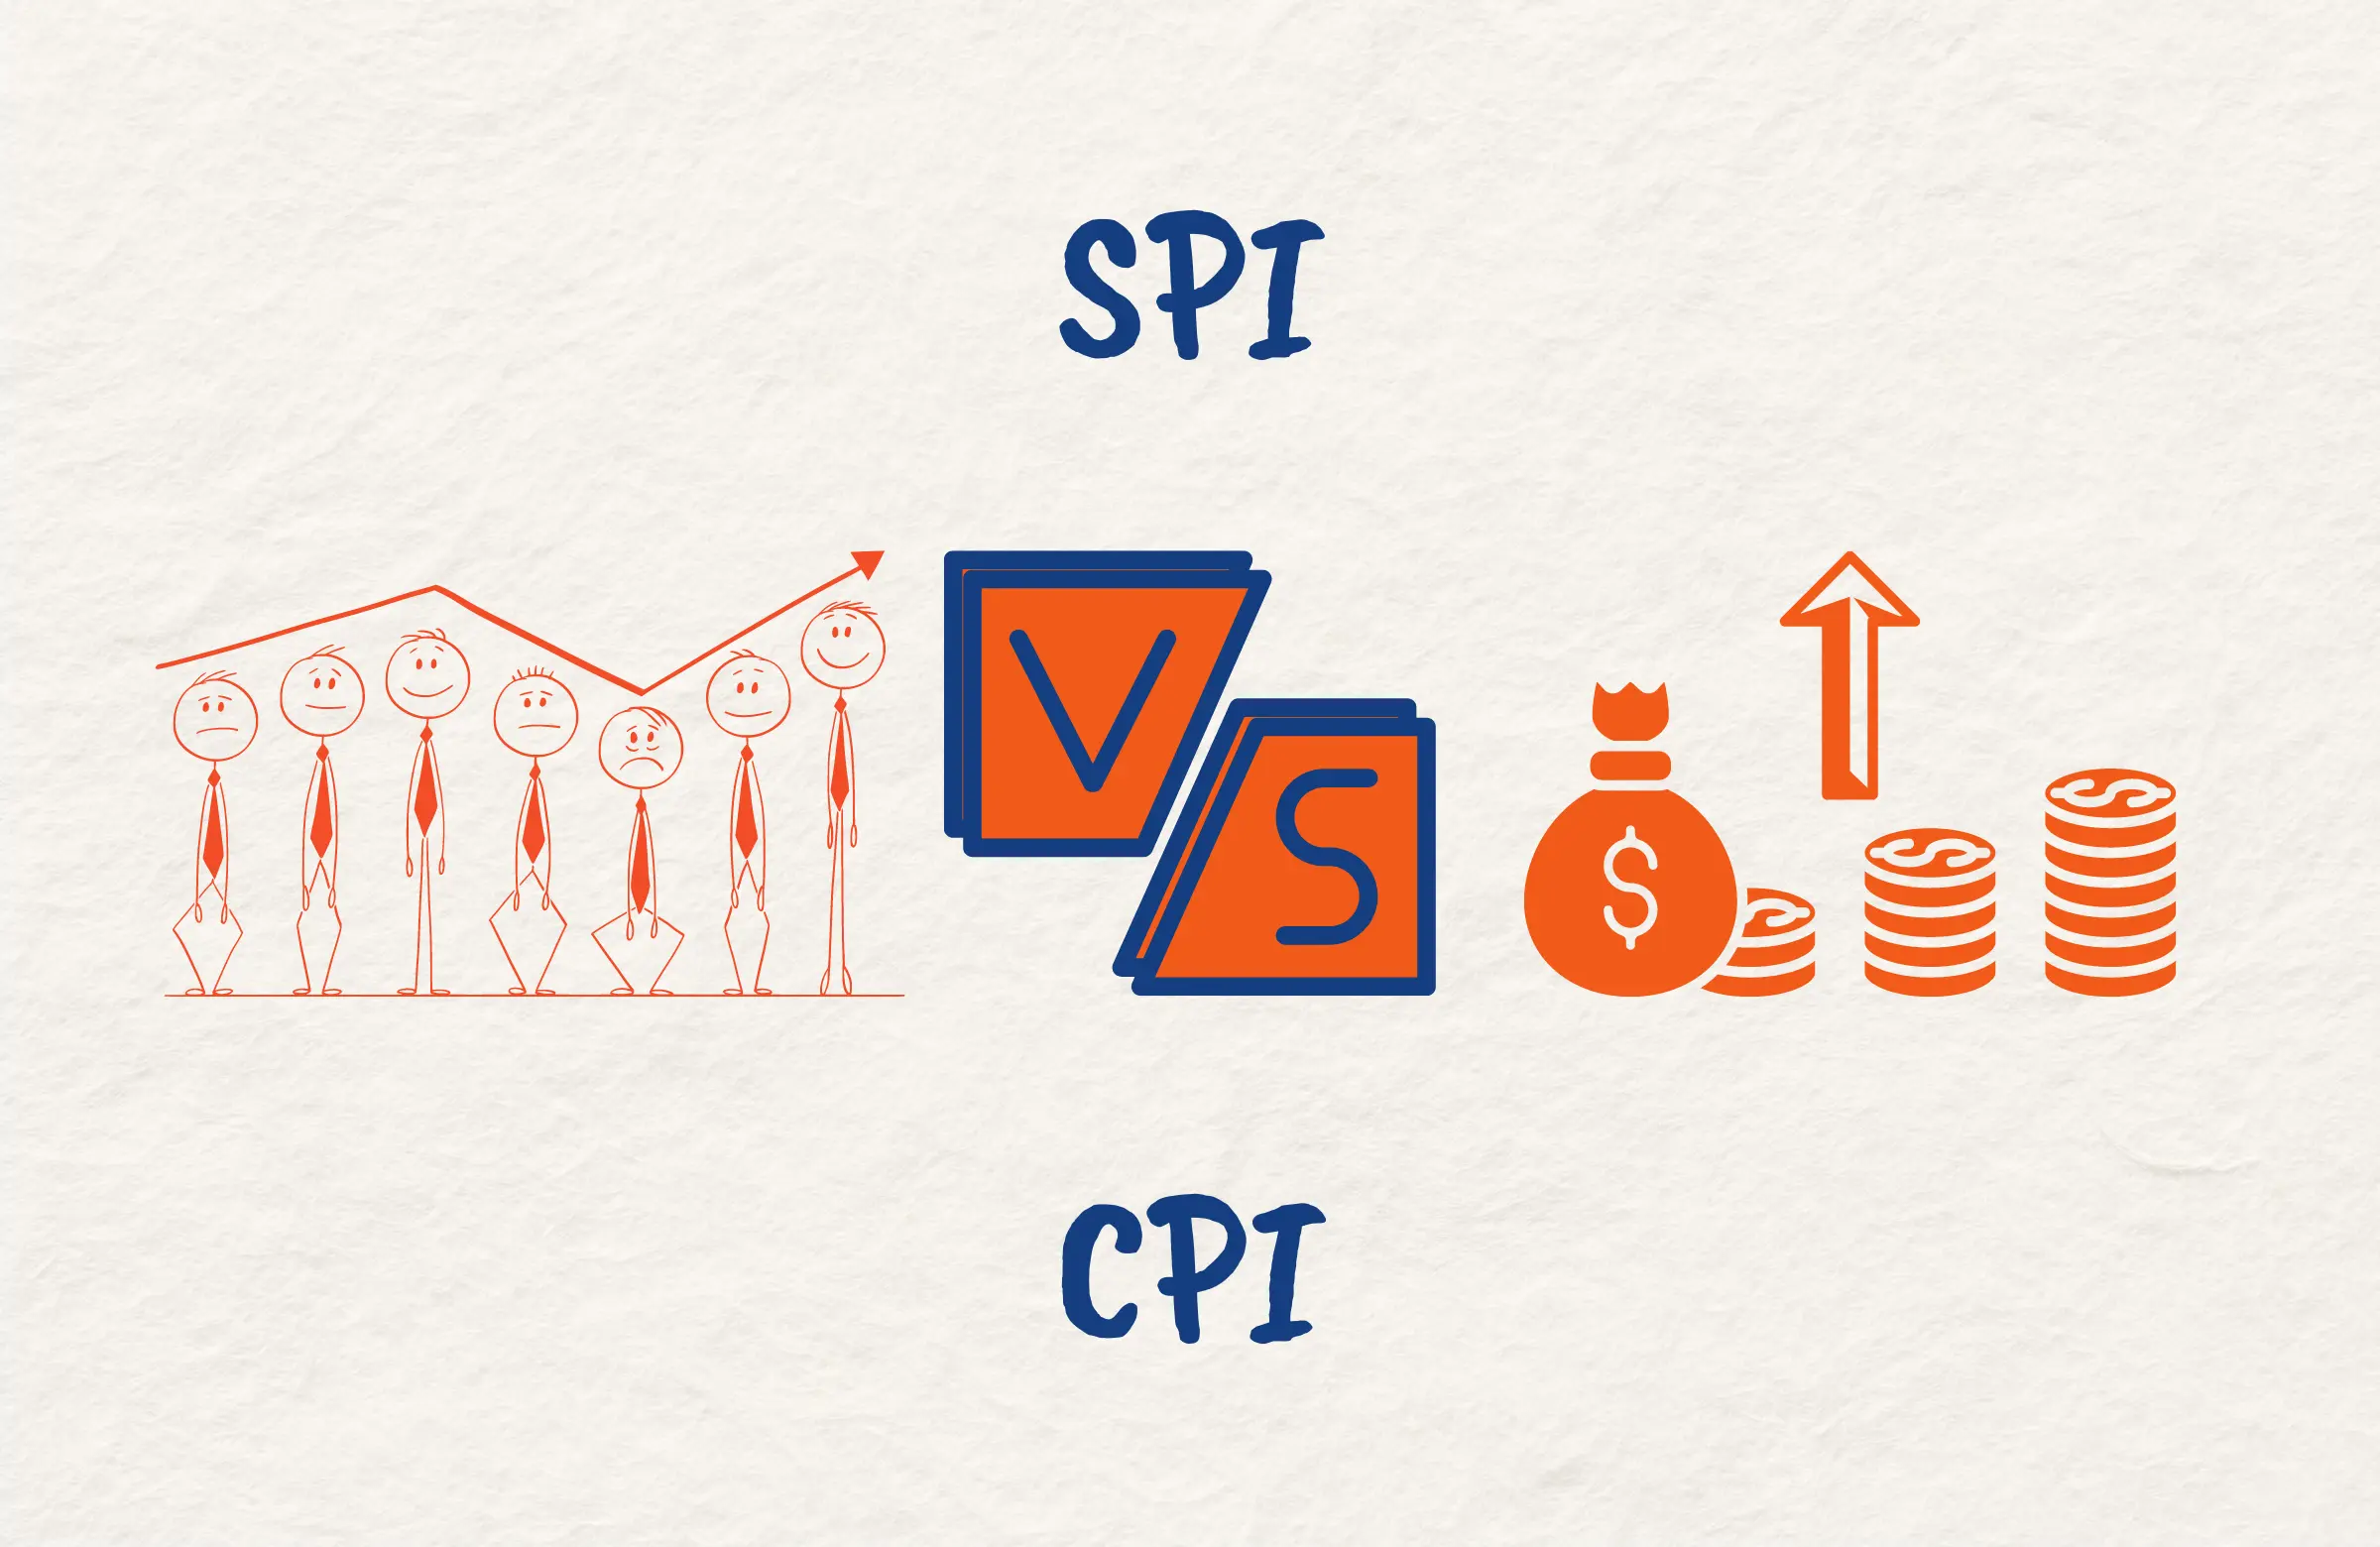
Bottomline Upfront: The main difference between the SPI and CPI is that SPI measures schedule performance and indicates if you are on track schedule-wise by comparing earned value to planned value while CPI measures cost performance and shows if you are on budget by comparing earned value to actual costs.
You will have a better understanding of other key differences between them as you read further in this article.
What is the Schedule Performance Index (SPI) in Project Management?
The Schedule Performance Index (SPI) is a key metric used to measure a project’s progress in terms of the project schedule. It indicates the efficiency of the time utilized on the project.
SPI measures how much of the scheduled work has been completed. It is calculated by comparing the work performed to the work planned. The earned value is divided by the planned value to arrive at the SPI.
As a project manager, you need to regularly monitor the SPI to determine if your project is on track schedule-wise. An SPI value equal to 1 means the project is perfectly on schedule. An SPI greater than 1 indicates the project is ahead of schedule. If the SPI is less than 1, then the project is behind schedule.
The SPI can be calculated for a specific period or cumulatively for the entire project duration. Tracking SPI trends over time will quickly indicate if your project is staying on schedule or gradually falling behind. An improving SPI trend is favorable, while a declining SPI trend indicates problems in maintaining the schedule.
Regularly monitoring SPI allows you to identify schedule problems early and then take timely corrective actions to bring the project back on schedule. This helps avoid missing major timeline milestones or delaying the final project delivery.
Schedule Performance Index Formula
The Schedule Performance Index (SPI) is calculated by dividing the earned value (EV) by the planned value (PV).
The mathematical formula is:
SPI = EV / PV
Where:
- EV = Earned value, the value of the completed work
- PV = Planned value, the scheduled budget for completed work
The earned value is the budgeted cost of work performed to date while the planned value is the budgeted cost of work scheduled to be performed by a certain point.
How is the Schedule Performance Index Calculated?
To calculate SPI, you first need to determine the earned value and planned value.
The earned value represents the amount of work completed expressed in the monetary terms of the project budget.
To calculate it, first determine the % completion of each project activity. Then multiply the % complete by the activity’s budget to get its earned value. Sum up the earned values across all activities to get the total EV.
The planned value is the budgeted cost of work scheduled to be completed by a certain point. It is derived from the project schedule. Refer to the timeline to determine which activities should be completed by the status date. Sum up the budgets of those activities to determine the PV.
Once you have the EV and PV, simply divide EV by PV to calculate SPI.
For example, say your project has 3 activities which are A, B, and C with budgets of $50,000, $20,000, and $30,000 respectively.
If A is 50% complete, B is 100% complete, and C was scheduled to be 20% complete by the status date, then:
EV = 50% of $50,000 + 100% of $20,000 + 20% of $30,000 = $25,000 + $20,000 + $6,000 = $51,000
PV = $50,000 + $20,000 + 20% of $30,000 = $50,000 + $20,000 + $6,000 = $76,000
SPI = EV/PV = $51,000/$76,000 = 0.67
So for this example, the SPI is 0.67, indicating the project is behind schedule.
How is the Schedule Performance Index Interpreted?
Interpreting the SPI value is straightforward:
- SPI = 1 means the project is perfectly on schedule. The earned value equals the planned value.
- SPI > 1 indicates the project is ahead of schedule. The earned value is higher than planned.
- SPI < 1 means the project is behind schedule. The earned value is less than planned.
The further the SPI is from 1, the greater the schedule variance. For example, an SPI of 0.9 indicates a small schedule delay whereas an SPI of 0.5 indicates the project is significantly behind.
For your project, you want the SPI to be close to or greater than 1. A declining SPI trend over time is unfavorable and means you are gradually falling further behind schedule.
An improving SPI trend indicates you are getting back on track. When SPI is below 1, you’ll need to implement corrective actions like adding resources or working overtime to catch up.
What is the Cost Performance Index (CPI) in Project Management?
The Cost Performance Index (CPI) is another important metric used to assess your project’s progress in terms of the budget. It provides a measure of the cost efficiency by comparing the completed work to the actual costs.
CPI indicates how much value you are getting for each dollar spent on the project. It is calculated by dividing the earned value by the actual costs spent.
Monitoring CPI allows you to determine if your project is over or under budget. A CPI equal to 1 means the cost is exactly as planned. A CPI greater than 1 indicates the project is under budget. If CPI is less than 1, then costs are higher than planned and the project is over budget.
Like SPI, CPI can be calculated for a specific period or cumulatively for the entire project. Regularly tracking CPI trends helps identify budget problems early. A declining CPI requires swift corrective action to get costs back in line and avoid budget overruns.
An improving CPI trend means your cost efficiency is increasing. By keeping the CPI above 1, you are spending less than planned to complete work. This allows potential savings to be realized. Understanding CPI helps project managers ensure the budget stays on track and maximize value for money.
Cost Performance Index Formula
The Cost Performance Index is calculated by dividing the earned value (EV) by the actual cost (AC).
The formula is:
CPI = EV / AC
Where:
- EV = Earned value, the budgeted value of the completed work
- AC = Actual cost, the actual expenditure to complete the work
The earned value represents the value of the work performed while the actual cost is what has actually been spent.
How is the Cost Performance Index Calculated?
Almost similar to the SPI calculation, you first need to determine the earned value (EV) and actual cost (AC) to calculate the CPI.
Earned value is calculated by multiplying the percentage completion of each activity by its budget. Sum up these values across all activities to get the total EV.
Actual cost is the total of all money spent on labor, materials, equipment, etc., and represents the actual expenditure made on the project so far.
Once you have the EV and AC, divide EV by AC to arrive at the CPI.
Using the same example of a project with 3 activities A, B, and C, and budgets of $50,000, $20,000, and $30,000 respectively. If A is 50% complete, B is 100% complete, and $80,000 has been spent in total, then:
- EV for A = 50% of $50,000 = $25,000
- EV for B = 100% of $20,000 = $20,000
- EV for C = 0 since no progress yet
Total EV = $25,000 + $20,000 + $0 = $45,000
Actual Cost = $80,000
CPI = EV/AC = $45,000/$80,000 = 0.56
So for this example, the CPI is 0.56, indicating the project is over budget.
How is the Cost Performance Index Interpreted?
Once you have calculated the CPI, you need to know how to interpret it.
- CPI = 1 indicates costs are exactly as planned. The earned value equals actual costs.
- CPI > 1 means the project is under budget. The earned value is higher than the actual costs.
- CPI < 1 signifies the project is over budget. The earned value is lower than the actual costs.
The further the CPI is from 1, the greater the cost variance. For example, a CPI of 0.95 indicates a small budget overrun while a CPI of 0.7 means significant cost overruns.
You want the CPI for your to be close to or greater than 1. A declining CPI trend over time is unfavorable and means cost performance is worsening.
An improving CPI trend indicates cost efficiency is increasing. If CPI is below 1, you’ll need corrective action to reduce spending and get back on budget.
Key Difference Between SPI and CPI
Though SPI and CPI are both important metrics to track project performance, there are some key differences between the two indexes:
Focus Area
SPI focuses on schedule performance and measures efficiency related to the project timeline and meeting deadlines. CPI on the other hand focuses on cost performance and measures efficiency related to the project budget and staying within costs.
Trend Analysis
Tracking SPI trends over time helps understand if the project is meeting timelines while tracking CPI trends helps assess if spending is within budgeted limits.
Corrective Actions
For low SPI, actions like adding resources or working overtime can improve schedule performance. Conversely, for low CPI, actions like reducing scope or finding cost efficiencies can improve budget performance.
Reporting
SPI allows reporting on time variance and causes for schedule issues while CPI allows reporting on cost variance and causes for budget issues.
Benchmarking
SPI values can be compared across projects to benchmark schedule efficiency while CPI values can be compared across projects to benchmark cost management.
SPI vs CPI Examples
Here are examples of SPI and CPI for further clarity.
Schedule Performance Index (SPI) Example
Let’s look at an example to understand how to calculate and interpret SPI.
A project has 4 activities A, B, C, and D with the following budgets:
- Activity A: $50,000
- Activity B: $20,000
- Activity C: $30,000
- Activity D: $10,000
The project’s total budget is $110,000.
By the status date:
- Activity A is 50% completed
- Activity B is fully completed
- Activity C is supposed to be 40% completed as per schedule
- Activity D has not started yet
To calculate SPI:
- Earned value (EV) = Activity A 50% x $50,000 + Activity B 100% x $20,000 + Activity C 40% x $30,000 = $25,000 + $20,000 + $12,000 = $57,000
- Planned value (PV) = $50,000 + $20,000 + 40% x $30,000 = $50,000 + $20,000 + $12,000 = $82,000
SPI = EV/PV = $57,000 / $82,000 = 0.70
Since the SPI is 0.70, it indicates the project is behind schedule. Corrective actions would be needed to improve performance and get back on track.
Cost Performance Index (CPI) Example
Let’s look at an example for calculating and interpreting CPI.
A project has 3 activities with the following budgets:
- Activity 1: $80,000
- Activity 2: $50,000
- Activity 3: $20,000
The total project budget is $150,000.
By the status date:
- Activity 1 is 25% completed
- Activity 2 is fully completed
- The actual cost spent is $100,000
To calculate CPI:
- Earned value (EV) = Activity 1 25% x $80,000 + Activity 2 100% x $50,000 = $20,000 + $50,000 = $70,000
- Actual cost (AC) = $100,000
- CPI = EV/AC = $70,000/$100,000 = 0.70
Since the CPI is below 1, it indicates the project is over budget. Cost control measures would be needed to bring spending in line with the budget.
Importance of Monitoring CPI and SPI in Project Management
Regularly monitoring and analyzing CPI and SPI trends is critical for project success. Here are some reasons why it’s important:
1. Identify Variances
CPI and SPI allow you to quantify and report on schedule and cost variances which helps in understanding the magnitude of issues.
2. Root Cause Analysis
A further drill-down into activities causing poor CPI or SPI allows root cause analysis and helps diagnose why variances are occurring.
3. Early Warning Signs
Declining CPI and SPI act as early warning signs of future problems. Identifying issues early allows corrective actions to be taken in a timely and cost-effective manner.
4. Corrective Actions
CPI and SPI trends help determine the appropriate actions to improve performance. For low SPI, adding resources may help, while for low CPI, reducing scope could work.
5. Control Efficiency
Regular monitoring allows for assessing if corrective actions and controls are improving efficiency.
6. Forecasting
Historical CPI and SPI data can be used to forecast future project performance.
7. Benchmarking
CPI and SPI values can also be used for benchmarking across projects to compare efficiency.
Conclusion
As discussed in this post, the Schedule Performance Index (SPI) and Cost Performance Index (CPI) are critical metrics when managing projects to regularly monitor and control project performance.
These indexes highlight the project’s efficiency in terms of meeting schedules and budgets. Tracking SPI and CPI trends allows identifying issues early and taking timely corrective actions.
Mastering these concepts and calculating SPI and CPI helps you deliver projects successfully while maximizing value. So focus on improving these performance indexes for effective project management.

