Product Owners play a critical role in guiding the vision and strategy of a product. But how do we measure the effectiveness and impact of a Product Owner in product development?
By tracking the right metrics, we can gain insights into how well a Product Owner is performing the required core responsibilities and identify areas for improvement.
In this guide, we will explore 15 top Product Owner KPIs spanning strategic, stakeholder, execution, product outcome, and growth objectives that can be measured to assess the Product Owner’s performance.
By regularly reviewing your performance across these areas, you can optimize your skills as a Product Owner and ensure you are delivering maximum business value.
The Role of a Product Owner in Product Development
As earlier iterated, a Product Owner plays a critical leadership role in guiding the vision, strategy, and execution of product development.
The responsibilities of a Product Owner include clearly articulating the product vision to all stakeholders, maintaining the Product Backlog, and working closely with the development team to ensure the product delivers maximum value to users and the business.
As a Product Owner, you serve as the voice of the customer while balancing business objectives. You should continuously promote the product and its value across the organization to obtain buy-in and collaboration.
Your central focus is on the customer experience, prioritizing features, and facilitating iterative delivery of a high-quality product that achieves key outcomes.

Strategic Product Owner KPIs
As a Product Owner, you play a pivotal role in steering the product towards achieving its strategic goals. You’re tasked with aligning product development with the vision, strategy, and business value.
Key Performance Indicators (KPIs) that can help you assess how well these tasks are being executed include:
1. Product Vision Execution
Firstly, consider the execution of the product vision. This KPI gauges how effectively the product development is aligned with the initial vision.
Your role is to ensure that every Sprint, every feature, and every design decision propels the product toward this vision. To measure this, you could establish a ‘vision alignment score’.
This involves assessing each product feature or update based on its contribution to the vision. For instance, you and your stakeholders could rate the alignment on a scale of 1 (not aligned) to 5 (fully aligned).
2. Product Strategy Alignment
Next, think about product strategy alignment. This KPI measures the extent to which product development aligns with the broader business and product strategy.
Your task is to align the product with business goals, market positioning, and competitive strategy.
To quantify this KPI, set specific, measurable goals related to the strategy, such as expanding market share, achieving customer acquisition targets, or driving revenue growth. Then, track the product’s progress towards these goals.
Remember, it’s crucial to review and update the strategy as necessary and ensure the product development remains aligned with any changes.
3. Business Value Delivery
Then, consider the business value delivery. This KPI reflects the tangible value that the product contributes to the business.
This could be in the form of financial returns, customer acquisition and retention, enhanced brand recognition, or other forms of value that align with the business’s strategic objectives.
To measure this KPI, track metrics like revenue generated, cost savings from improved internal processes, customer churn rate, customer lifetime value (CLV), or net promoter score, depending on what represents value for your business.
Defining these metrics at the project’s outset and monitoring them regularly will help you stay focused on delivering real value.

Stakeholder KPIs for Product Owners
Your responsibilities as a Product Owner extend beyond just the product; they include managing relationships with various stakeholders. You serve as the connective tissue across various business units and teams.
Monitoring your ability to build trusted partnerships and smoothly collaborate with these stakeholders via the following KPIs is essential for maximizing your influence and impact.
1. Stakeholder Satisfaction
Stakeholder satisfaction is a crucial KPI that reflects the extent to which the product’s output meets the needs and expectations of its stakeholders.
Through regular surveys or feedback sessions, you can measure how satisfied stakeholders are with the product. Stakeholders might rate their level of satisfaction on a scale from 1 (very dissatisfied) to 5 (very satisfied), providing an overall satisfaction score.
Your goal is to witness an upward trend in these scores, indicating the product is consistently meeting or exceeding stakeholder expectations.
2. Stakeholder Engagement
Stakeholder engagement refers to the level of active participation and involvement of stakeholders in the project.
You can gauge this KPI through metrics such as attendance at stakeholder meetings, frequency of communication between you and stakeholders, and stakeholders’ responsiveness to queries or requests for feedback.
High stakeholder engagement often indicates a successful product, suggesting that stakeholders feel committed to the project.
Conversely, low engagement levels could signal a disconnect between the product and its stakeholders, potentially risking the product’s success.
3. Cross-Team Collaboration
Cross-team collaboration is a vital KPI that measures your effectiveness in promoting and facilitating collaboration between different teams working on the project.
Ways to track this KPI include monitoring the frequency and quality of inter-team meetings, tracking shared milestones or objectives, and using Collaborative Software to assess the level of team interaction and collaboration.
Strong cross-team collaboration can lead to innovative solutions, faster problem-solving, and improved product quality.
On the other hand, poor collaboration could result in silos, creating inefficiencies and misunderstandings that might lower product quality.

Product Owner KPIs for Project Execution
This area of KPIs focuses on your ability to effectively groom and prioritize the Product Backlog, as well as successfully execute iterative delivery.
As a Product Owner, your role involves not just strategic planning but also effective execution. Several Key Performance Indicators (KPIs) can help you gauge the efficiency of your execution processes including:
1. Backlog Grooming
Backlog grooming (also known as backlog refinement) is a vital KPI that measures your effectiveness in managing the Product Backlog. This involves keeping the backlog organized, prioritized, and up-to-date.
You can measure this KPI through metrics like the percentage of backlog items that meet the ‘definition of ready‘ for Sprint Planning and the frequency with which you update and refine the backlog.
A well-groomed backlog ensures that your development team can pick up tasks smoothly and maintain a steady pace of work.
2. Sprint Planning Effectiveness
The effectiveness of your Sprint Planning events is another important KPI that measures the overall efficiency of your product development execution.
This involves setting clear goals for each Sprint, ensuring tasks are well-defined, and that they align with the product’s overall objectives.
Metrics to measure this KPI could include the percentage of Sprint Goals achieved, the number of tasks completed per Sprint versus the number planned, and the team’s velocity.
Effective Sprint Planning can boost your team’s productivity and ensure that product development stays on track.
3. Time-to-Market
Time-to-market is a crucial KPI that measures the speed at which your product (or new features of the product) is delivered to the market.
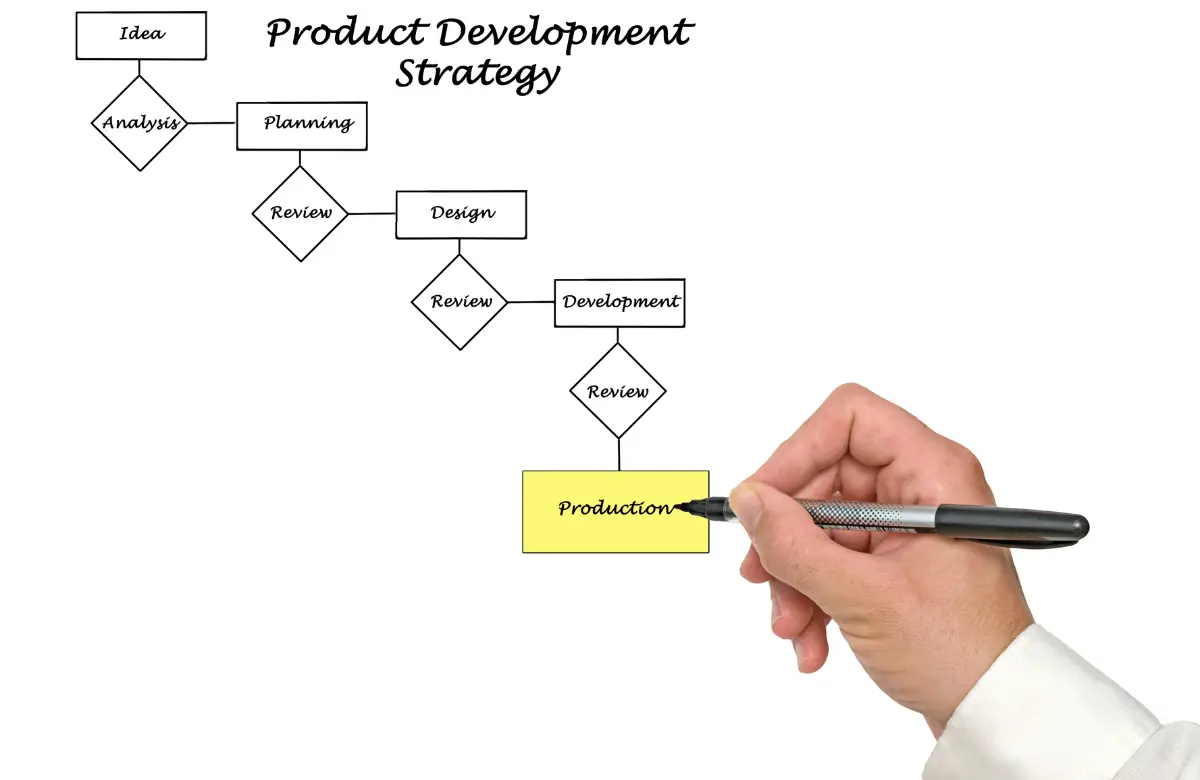
This involves all stages of the product life cycle, from initial concept and design to development, testing, and final release. You can measure this KPI by tracking the time taken from the initiation of a product or feature to its release.
A shorter time-to-market can give you a competitive advantage, allowing you to respond quickly to market changes and customer needs.
However, it’s important not to sacrifice quality for speed, as this could impact the product’s success in the long term.

Product Owner KPIs for Product Outcome
Your ultimate goal as a Product Owner is to drive successful product outcomes. Key Performance Indicators (KPIs) related to product outcomes can help you understand whether your product is achieving its intended results.
1. Product Adoption
Product adoption is a significant KPI that measures the rate at which your target users start to use your product. High product adoption indicates that your product is meeting a market need and that users find it valuable.
You can measure product adoption using metrics like the number of new users over a specific period, the rate of repeat usage, or the percentage of your target market that has adopted the product.
Consistently monitoring these metrics can help you identify any barriers to adoption and address them promptly.
2. Customer Satisfaction
Customer satisfaction is an important KPI that reflects how happy your customers are with your product.
It gives you insights into the quality of the user experience, the appeal of your product features, and the effectiveness of your customer service.
To measure this KPI, you could use surveys to gather direct feedback from users, track the Net Promoter Score (NPS), or analyze product reviews and ratings.
High customer satisfaction can lead to increased loyalty, word-of-mouth referrals, and long-term customer retention.
3. Product ROI
Product ROI (Return on Investment) is a crucial KPI that measures the financial effectiveness of your product.
It provides a clear picture of the product’s profitability by comparing the revenue it generates with the costs associated with developing and maintaining it.
To calculate this KPI, subtract the total product cost from the total revenue generated by the product, then divide the result by the total product cost.
The resulting figure, expressed as a percentage, is your product’s ROI. A high ROI indicates that the product is a profitable investment for your company.

Product Owner KPIs for Product Growth
Your role as a Product Owner isn’t limited to managing the present—it extends to fostering growth for the future.
Key Performance Indicators (KPIs) related to growth that can help you ensure that your product and team are continuously evolving and improving include:
1. Continuous Improvement
Continuous improvement is a vital KPI that measures your team’s ongoing efforts to refine processes, enhance product quality, and increase efficiency. This KPI reflects a mindset of always looking for ways to do things better.
You can measure this KPI through metrics such as the percentage reduction in bugs or errors over time, improvements in team velocity, or the reduction in time taken for routine tasks.
A culture of continuous improvement can lead to consistent enhancements in product quality and team productivity.
2. Innovation Pipeline
The innovation pipeline is an important KPI that gauges your team’s capacity to generate new ideas and translate them into viable product features or improvements.
This KPI is crucial for ensuring your product remains competitive and relevant in the market.
You can measure this KPI by tracking the number of new ideas generated, the percentage of ideas that make it to the development stage, or the number of new features or enhancements released over a specific period.
A healthy innovation pipeline indicates a proactive approach to product growth and development.
3. Skill Development
Skill development is a crucial KPI that focuses on the growth and development of your team members.
As a Product Owner, part of your role is to ensure that your team has the skills and knowledge necessary to meet the evolving demands of the product.
You can measure this KPI by tracking the number of training hours per team member, the percentage of team members who attend skill development sessions, or improvements in performance metrics following training.
Investing in skill development can enhance your team’s capabilities, increase job satisfaction, and ultimately lead to a higher-quality product.
Product Owner Performance Goals Examples
Setting outcome-focused performance goals across key product focus areas will help maximize your impact and alignment with business objectives.
Here are some examples of potential performance goals to set as a Product Owner:
- Achieve customer satisfaction score increase from 4.2 to 4.5 in 2024 through a prioritized focus on usability improvements.
- Improve product adoption by 15% year-over-year by enhancing onboarding, documentation, and in-app guidance.
- Launch 2 new innovative product capabilities leveraging AI/ML technology to increase differentiation.
- Complete migration to new tech stack by Q3 roadmap milestone through close management of backlog prioritization and Sprint execution.
- Demonstrate ROI of at least 130% for the product in 2024.
- Conduct quarterly stakeholder interviews and improve net promoter score among key stakeholders from 7 to 9.
- Implement new Agile development processes to reduce average cycle time from idea to production release by 20%.
- Create a knowledge-sharing program and provide relevant training to help team members gain 2 new specialized skills each.
- Improve new feature time-to-market by setting up an innovation lab and holding bi-weekly hackathons to quickly prototype concepts.
- Run regular usability studies and translate insights into 30+ optimization releases.
Conclusion
The 15 Product Owner KPIs covered across the key areas of product strategy, stakeholders, execution, outcomes, and growth provide a comprehensive view of your effectiveness as a Product Owner.
Regularly monitoring this robust set of Product Owner KPIs is crucial for optimizing your product leadership. They enable you to pinpoint specific opportunities to improve processes, demonstrate business impact, and advance the product and team.
In today’s dynamic market, focusing on measurable outcomes is key to excelling as a Product Owner. Commit to tracking these KPIs to benchmark your current performance, showcase the value you deliver, and unlock areas for growth.
With the right metrics, you can elevate your product leadership to the next level.