
Metrics are essential for successful Agile software development. They provide transparency into a team’s progress and performance, enable data-driven decision-making, and foster continuous improvement.
For Scrum teams, metrics offer visibility into the health of sprints, projects, and processes to build better products, meet commitments to stakeholders, and achieve business goals.
In this comprehensive guide, we will explore Scrum metrics in detail. We will discuss the importance of metrics, review the most valuable metrics for Scrum teams, debunk common misconceptions, and provide tips for effective use of metrics.
Read on to gain a holistic understanding of how to leverage metrics to optimize your Scrum projects.
The Importance of Metrics in Scrum
Metrics serve several vital purposes for Scrum teams:
- Transparency: Metrics provide visibility into progress, productivity, quality, and team well-being. They promote shared understanding and enable fact-based discussions.
- Adaptability: Metrics highlight areas for improvement so teams can make changes to optimize their workflow and outcomes. They support empirically driven development.
- Predictability: Historical metrics allow teams to estimate future performance and make reliable plans. They provide the data needed for accurate forecasting and capacity planning.
- Accountability: Metrics define key outcomes, progress markers, and success criteria so teams can own their commitments and achievements. They encourage a results-oriented mindset.
Essential Scrum Metrics
While there are many metrics Scrum teams can employ, the following are most crucial:
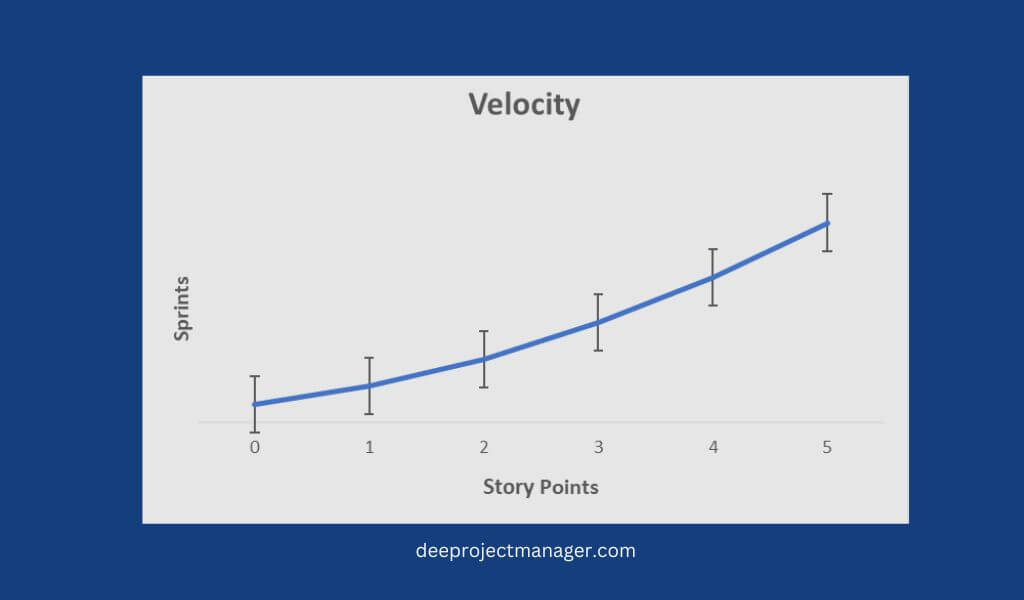
1. Velocity
Velocity is a key Scrum metric that measures the amount of work a team can complete during a sprint.
It is calculated by estimating the effort for each user story in story points, then summing the story points for all the stories that were completed in a sprint.
Over time, the velocity of a team should stabilize, which makes it useful for forecasting how much work a team can complete in future sprints.
However, velocity should not be used to compare teams, as each team’s velocity is unique based on their skills and environment.
Velocity is a simple but valuable metric for any Scrum team to track their progress over multiple sprints.
2. Burndown Charts
A burndown chart graphically depicts work remaining in a sprint over time. The x-axis shows days in the sprint, the y-axis represents remaining work (usually story points), and a line downward from left to right shows progress being made toward completing the work.
Burndown charts provide at-a-glance visibility into whether a team is on track to finish work as planned and highlight unrealistic scope early so teams can make adjustments to achieve their Sprint Goal.
By monitoring the burndown chart daily, teams can identify impediments right away and take corrective actions.
Clear burndown charts also signal efficient progress and a steady work cadence, increasing confidence in the team’s ability to meet their definition of done for the sprint.
Though simple, burndown charts are a useful metric for transparency into sprint progress and promoting the inspection and adaptation Scrum teams require.
At regular daily standups, burndown charts stimulate discussions about obstacles and appropriate solutions to stay on track.
3. Burnup Chart
A burnup chart is a visual metric that shows the progress of work completed over multiple sprints.
It has two lines: one shows the total scope of work for a release, product, or project, and the second line shows the amount of work completed over time, and both lines meet at the projected completion of all the work.
Burnup charts are useful for Scrum teams to track their progress towards a goal or release as they provide insight into the team’s velocity and ability to complete the total scope.
The slope of the burnup line also shows if the team is ahead or behind schedule. If behind, the team may need to reduce scope, add resources, or improve processes.
Burnup charts give transparency into progress for both the team and stakeholders and highlight when scope changes or additional resources may be needed to meet commitments.
For Scrum teams seeking data to improve forecasts and planning, the burnup chart is a valuable metric to track.
4. Cumulative Flow Diagram (CFD)
The Cumulative Flow Diagram (CFD) is a useful metric for Scrum teams to track progress and identify bottlenecks.
A CFD shows the cumulative work items in a given state over time. It highlights the smoothness of flow through the different steps in a process.
For Scrum teams, it could show the flow of user stories or tasks from the backlog, through development, testing, and done.
A CFD can reveal issues like stories stuck in a particular phase or uneven work distribution between sprints.
The slope of the curves shows the rate of work being completed, flatter slopes indicate lower throughput.
CFDs provide transparency for the whole Scrum team and an easy visualization of the workflow process.
Reviewing trends in the CFD at regular Sprint Retrospectives allows the team to discuss improvements to optimize the flow of work.
5. Sprint Goal Success Rate
The Sprint Goal Success Rate measures how often a Scrum team achieves the Sprint Goal they set during Sprint Planning.
The Sprint Goal summarizes the key objective or desired outcome for the Sprint. At the Sprint Review, the team determines if the Sprint Goal was met.
Calculating the Sprint Goal Success Rate over multiple Sprints shows how well the team is predicting and committing to meaningful goals.
A high success rate, e.g. over 80%, indicates the team is good at setting ambitious yet achievable Sprint Goals.
A low success rate suggests the team may be overcommitting or struggling to complete priority work.
Reviewing how and why certain Sprint Goals were missed helps the team improve their planning and estimation processes.
The Sprint Goal Success Rate also builds transparency into team productivity and helps set stakeholder expectations.
6. Defect Density
Defect Density measures the number of defects found in a product or component over its size. For Scrum teams, it can be used to track the quality of incremental product releases across Sprints.
It is calculated as the total defects divided by size, e.g. story points. A decreasing trend shows improved quality and reduced rework.
Monitoring Defect Density helps Scrum teams balance high velocity with high quality. If Defect Density starts climbing, it signals the need to slow down and focus on technical excellence or testing.
Reviewing the types of defects found also highlights areas for education or process improvement. Defect Density should be calculated from customer feedback and live production data, not just internal testing.
Defect Density is a key Scrum metric for building quality in and maximizing the value of a product. By consistently reducing Defect Density Sprint after Sprint, Scrum teams can deliver products that delight customers with higher quality and greater reliability.
7. Team Happiness
Team happiness is an important metric for Scrum teams to track.
While traditional metrics like velocity, burn down charts, and defect rates are useful to measure progress, they fail to capture the overall team dynamic and well-being.
Happy, motivated teams that enjoy working together will be more productive and deliver higher quality results.
Some ways to measure and promote team happiness include:
- Conducting regular “team happiness surveys” to allow members to anonymously provide feedback. Look for trends and discuss as a team.
- Starting standups with a quick “team mood check” to get a pulse on energy levels.
- Celebrating wins and milestones together. Make space for team lunches, events, and off-sites.
- Emphasizing work-life balance. Avoid excessive overtime and make sure team members take regular vacations.
- Fostering an environment of psychological safety where all ideas and feedback are valued. Promote open communication and support.
- Focusing on continuous improvement of team dynamics and not just technical or project outcomes. Team happiness deserves just as much priority as any other metric.
While happiness can seem like an intangible metric, paying attention to team dynamics, morale, and well-being pays huge dividends when building highly productive, motivated teams.
8. Customer Satisfaction
Scrum teams should make customer satisfaction a key metric and area of focus.
Some ways to track customer satisfaction include:
- Conducting regular customer interviews and surveys to gain actionable feedback. Look for trends in responses over time.
- Monitoring online reviews and social media mentions. What do customers like? What needs improvement?
- Analyzing product usage and metrics to see what features are most and least used. Make data-driven product decisions based on insights.
- Gaining feedback with each release. Ask open-ended questions about experience with new features and overall impressions.
- Involving customer representatives directly in the development process through guest appearances at standups or reviews. Discuss their experiences using the latest product increment.
- Reviewing customer satisfaction metrics and trends should be part of the team’s regular retrospectives. The team can then take actions to celebrate wins or make improvements based on the data.
Common Misconceptions about Scrum Metrics
Misconceptions about metrics can lead to their misuse and unintended consequences. Scrum teams should avoid:
- Using metrics to evaluate individuals: Metrics reflect team and project health, not individual performance. Judging individuals can damage trust and collaboration.
- Chasing metrics for their own sake: Meaningless metrics provide no value. Focus on metrics relevant to decision-making and improvement.
- Comparing teams with metrics: Each team faces unique challenges so comparisons are not meaningful or useful. Metrics should be tailored to a specific team’s context.
Tips for Effective Use of Metrics for Scrum
For effective use of metrics, Scrum teams should:
- Choose metrics that provide actionable insights. Focus on a small set of meaningful metrics, not every possible measure.
- Use metrics in combination to gain a broad, balanced perspective. Do not rely on any single metric.
- Set realistic targets based on past performance and current capacity. Do not establish arbitrary targets that could lead to burnout or reduce quality.
- Ensure all team members understand the purpose and importance of metrics. Promote a culture of continuous learning and improvement.
- Review and adapt metrics regularly to meet evolving needs. Eliminate metrics that are no longer useful and be open to new metrics that may be meaningful.
Conclusions
Scrum metrics empower teams to optimize their performance, accelerate learning, and drive results.
By selecting metrics purposefully, using them holistically, and leveraging them for continuous improvement, teams gain data-driven insights into their projects and processes.
Metrics support the transparency, adaptability, and predictability at the heart of Scrum.
However, metrics must be used properly to be effective. They should never be used to evaluate individuals or compare teams.
Chasing metrics for their own sake provides no benefit. Teams must focus on actionable insights and meaningful outcomes, not metrics themselves.